Counter App

Export Warehouse Counts to Excel or Google Sheets
Key takeaways
To export a warehouse count to a spreadsheet, export the Summary and Notes sections from Counter App — Tally & Clicker as CSV or Excel, paste them into a workbook beside system quantities, and match lines with a lookup on a shared SKU or location key. Variance in units, percent and value then drives which lines get recounted.
- Counter App — Tally & Clicker exports a warehouse count as CSV or Excel (XLSX) with selectable Summary, Events, Notes and Locations sections, or as an HTML report with photos.
- A warehouse variance workbook works best with three tabs: the untouched counted export, the system on-hand quantities, and a variance tab built with lookups.
- Matching warehouse counts to system quantities needs a shared key, such as the SKU or location ID at the start of every tag label.
- Variance value, not variance in units, is the better way to prioritize which warehouse lines need investigation first.
A count that lives only on a phone is half finished. The number of units in bin B3-07 means little until it sits next to what your inventory system thinks should be there, with the difference calculated and someone deciding what to do about it. That comparison happens in a spreadsheet for most small and mid-sized warehouses, and the quality of the export decides whether it takes ten minutes or an afternoon.
This is a step-by-step workflow for getting Counter App counts into Excel or Google Sheets, building a variance report that people actually read, and keeping a tidy archive so last quarter's count is never more than a few clicks away.
Step 1: Export the right sections
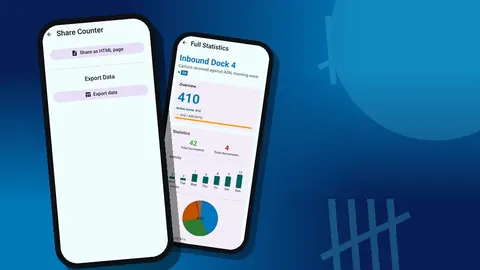
From the counter you just finished, open the share screen. You will see two paths: share as an HTML page, or export data. The HTML report is good for a readable summary with embedded photos, for example to send to a site lead. For analysis, choose export data.
The export options dialog offers four sections:
- Summary – one line per tag with its final value. This is the core of a variance report.
- Events – every individual tap, with time and before/after values. Useful for investigation, noisy for reporting.
- Notes – comments counters attached to events.
- Locations – the stored location of each tag.
For a routine report, Summary plus Notes is usually enough. Add Events when you expect to dig into a discrepancy. Then choose CSV or Excel. Excel keeps sections tidy in one file; CSV is the safer choice if another tool will import it later.
Step 2: Set up a workbook with three tabs
Build the workbook once and reuse it every count. A simple layout:
- Counted – paste the Summary export here, untouched.
- System – paste the on-hand quantities from your inventory system for the same items.
- Variance – the working tab, built with formulas that pull from the other two.
Never type over the raw tabs. If something looks wrong in the variance, you want to be able to see exactly what the phone said and exactly what the system said, without wondering who edited what.
Step 3: Make sure both sides share a key
The single most common reason an export is painful is the lack of a matching key. The counted data has "Shampoo 250 lavender", the system has "SHMP-250-LAV". A human sees they are the same; a formula does not.
Fix this at the source, in the tag setup. Two good options:
- Put the system SKU or location ID at the start of every tag label, such as "40-118 Shampoo 250 lav". Then a text function can split off the key.
- Store the code from the product or bin label in the tag's barcode field, and keep the label human-readable.
Whichever you choose, apply it to every tag in every counter. One inconsistent naming habit will cost more time than the whole rest of the workflow.
Step 4: Bring system quantities next to counted quantities
On the Variance tab, list the keys from the System tab in column A, since the system is the list of everything that should exist. Then use a lookup to pull the counted quantity for each key from the Counted tab. XLOOKUP, VLOOKUP or INDEX/MATCH all work; use whichever your team already knows.
Two edge cases deserve their own visible treatment:
- In the system, not counted. The lookup returns an error or blank. Wrap it so it shows "NOT COUNTED" rather than zero. A missing count and a genuine zero are very different findings.
- Counted, not in the system. Run the reverse lookup from the Counted tab. These are usually mislabeled bins, new items not yet entered, or typos in a tag name.
Step 5: How do you calculate variance?
Add three columns:
- Variance units = counted − system.
- Variance % = variance units ÷ system, guarded against division by zero.
- Variance value = variance units × unit cost, if you have costs in the system extract.
Value matters more than units for prioritizing. Being twenty screws short and being one pallet jack short are both "one line with a variance", but only one deserves a phone call today.
Step 6: Which accuracy formula should you use?
There is no single correct accuracy formula, so pick one and keep it for at least a year so the trend means something. Common choices:
- Line accuracy – the share of lines where counted equals system, or falls within a tolerance you define.
- Unit accuracy – one minus the sum of absolute unit variances divided by total system units.
- Value accuracy – the same idea weighted by cost.
Decide tolerances per item class rather than one global figure. A tolerance of a few units makes sense for bulk fasteners and none at all for serialized equipment. Write the definition at the top of the Variance tab so anyone reading the report knows what the percentage means.
Step 7: Make problems visible
A variance report with three hundred rows and no formatting gets skimmed and ignored. A few touches change that:
- Conditional formatting on variance value: red above your threshold, amber near it.
- A filter or sort that puts the largest absolute value variances at the top.
- A small summary block: lines counted, lines not counted, lines out of tolerance, total value variance.
- A comments column next to each flagged line for the person who investigates.
The goal is that a manager can open the file and know within a minute which five lines need action.
Counting in packs without breaking the math
If some tags use a step larger than one, check how the system stores the same item before you compare. A tag that counts cartons of 12 with a step of 12 already records units, so its value lines up with a system that tracks units. Trouble starts when one person counts in packs with a step of 1 while the system expects single units; the variance then looks like a huge shortage that does not exist. Add a small column on the Variance tab for the unit of measure on each side, and flag any line where they differ before anyone investigates. During setup, write the counting unit into the tag's notes field so the person who exports and the person who reconciles read the same rule. A minute spent on this column can prevent a whole morning of recounts for a problem that was never on the shelf.
Step 8: Use the event log to investigate
When a line is badly off, return to the phone or to the Events section of the export. The history shows every plus and minus with an exact timestamp and the value before and after. Patterns tell you a lot:
- A long run of plus taps, then several minus taps, suggests someone lost their place and corrected.
- A single large jump suggests a step value set to a pack size, which is correct if intentional and a problem if not.
- Taps spread over two days on one tag suggest the bin was counted by two people or in two sessions.
The events will not explain everything, but they turn "the count is wrong" into a specific question you can ask the person who counted.
Reading notes alongside the numbers
The All Notes screen collects every note counters left, with the tag it belongs to and its time, and lets you sort them. Read it before finalizing the report. A note such as "half the stock is in the returns cage" can explain a variance that would otherwise trigger an adjustment. If you exported the Notes section, paste it on its own tab and reference it from the comments column.
A monthly routine
For teams that count continuously, a light monthly rhythm keeps the reporting under control:
- Week end: export each finished counter and paste its summary into that week's Counted tab.
- Month end: consolidate the weeks, refresh the System tab with current on-hand, and recalculate.
- Review: sort by value variance, assign the top lines to someone, and agree on adjustments.
- Adjust: update the inventory system only after the variance is explained or recounted.
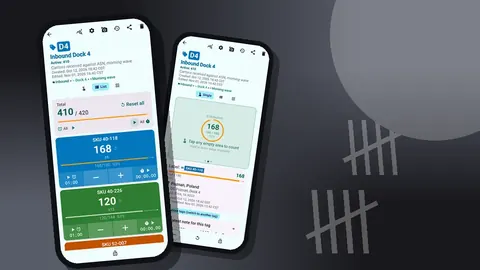
Before exporting, a glance at each counter's dashboard is a cheap sanity check. It shows the total against target, increments versus decrements, a seven-day activity chart and a pie chart by tag. If a counter shows almost no activity for an area you know was counted, something is off before you even open the spreadsheet.
If several people counted on separate phones, export from each and stack the summaries on the Counted tab with a column for who counted. There is no live sync between phones, so the workbook is where the combined picture lives.
How should you archive past counts?
Two kinds of archive are worth keeping:
- Spreadsheets. Save each period's workbook with a date in the filename. The trend in accuracy only exists if old workbooks survive.
- App backups. A backup ZIP includes the counters, history and photos. You can choose which counters or categories to include and compress photos to keep the file small. Store it wherever your team keeps records.
Counts are stored on the phone, with no account and no Counter App cloud, so the backup is your responsibility. If you ever need to restore, the import preview shows what the ZIP contains and lets you replace, copy or skip duplicate counters. That also makes it the way to move a set of counters to a new phone.
Where to go next
The spreadsheet is only as good as the count behind it. For a structure that makes exports easy, see organizing a warehouse by zone. For keeping counts frequent rather than annual, see running cycle counts.
Counter App works on Android 12 and later, and it is free to download with no ads; try it free for 3 days, then choose a yearly or monthly plan or a one-time lifetime purchase. Get the app at counterapp.online.
Frequently asked questions
Which export formats does Counter App offer for a warehouse count?
A warehouse counter can be exported as CSV, Excel (XLSX) or an HTML report with embedded photos. For CSV and Excel, the Summary, Events, Notes and Locations sections are chosen in the export options.
Can I open the export in Google Sheets?
Yes. Both CSV and XLSX files open in common spreadsheet programs, including Google Sheets once you upload the file.
Does the app back up warehouse counts to the cloud automatically?
No. Counter App has no account and no Counter App cloud, and counts are stored on the phone. Make a backup ZIP, with optional photo compression, and keep it wherever your team stores archives.
Can I include notes in the export?
Yes. Tick the Notes section in the export options and event notes are exported alongside the counts.
Can two counters' phones be combined automatically?
There is no live sync between phones. Export from each phone and stack the files in one workbook, or move counters between phones with a backup ZIP.
How should a counted item that is missing from the system be shown?
Run a reverse lookup from the Counted tab. Lines counted but not in the system are usually mislabeled bins, new items not yet entered, or typos in a tag name.
Why can a pack-size step make a variance look wrong?
If one person counts packs with a step of 1 while the system expects units, the variance shows a false shortage. A unit-of-measure column on the variance tab flags such lines before anyone recounts.