Counter App

A Warehouse Manager's Path to Better Count Accuracy
Key takeaways
This hypothetical scenario shows how a small distribution warehouse could improve inventory accuracy by replacing one annual count with daily phone cycle counts. Using Counter App — Tally & Clicker, the manager counts risky dock locations blind, reads the notes behind each variance, fixes staging and putaway, and reviews weekly exports in a spreadsheet.
- In this hypothetical scenario, a warehouse manager moves from one annual stocktake to short daily phone cycle counts with Counter App — Tally & Clicker.
- Sorting the annual variance report by value showed the scenario's manager that most of the drift sat in locations near the inbound dock.
- Notes left on count events revealed the scenario's main cause: stock booked as received but still in staging or put away in the wrong bin.
- Making staging its own counted zone and confirming putaway to a scanned location turned large, mysterious variances into small, explainable ones.
This is a hypothetical scenario. The warehouse, the people and all numbers are illustrative, not a customer case or research.
Picture a distribution warehouse of moderate size: a few thousand pick locations, two docks, a small mezzanine of spare parts, and a team of around a dozen. Call the manager Marta. Every January, the whole team stops shipping for a weekend and counts everything. Every January, the inventory system is corrected by a large amount. And every spring, the pickers start reporting empty bins that the system insists are full.
What follows is one way such a warehouse could move from that annual ritual to small daily counts on phones, and what Marta might learn along the way. It is a sketch of a process, not a promise of results.
The setting
Marta's warehouse has a perfectly good inventory system and a perfectly ordinary problem: the system's quantities drift away from the shelves. Picks get confirmed against the wrong bin, returns are put back where there was space rather than where they belong, receipts are booked in full when a carton was short.
The annual count corrects the drift once a year. It does not explain it. By January, nobody can say whether the errors on aisle 7 started in March or November, and the people who made them have long forgotten.
There are two handheld scanners on site, both permanently assigned to receiving. Everyone else has a phone.
What is the real problem behind the variance?
The first useful step is not technical. Marta sits down with the January variance report and asks a narrow question: where are the errors, and what kind are they?
Sorting the report by value variance rather than by line, a pattern appears in our scenario. A modest number of locations account for most of the value lost or found. Many of them are near the inbound dock. Several pairs of neighboring bins show mirrored errors, one over by roughly the amount the other is short.
That reframes the goal. Instead of "count everything more often", it becomes "count the risky locations often, find out why they drift, and fix the cause".
Trying the phone
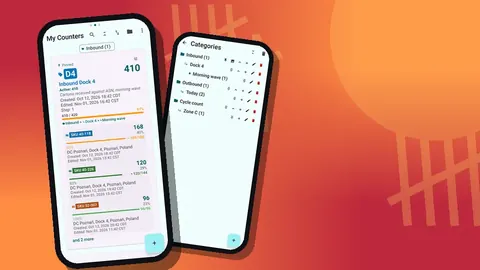
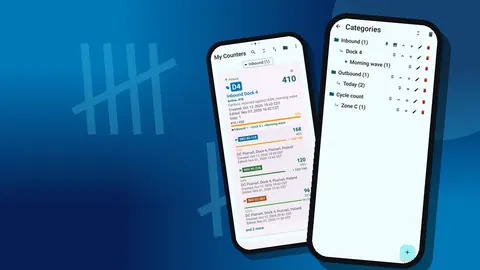
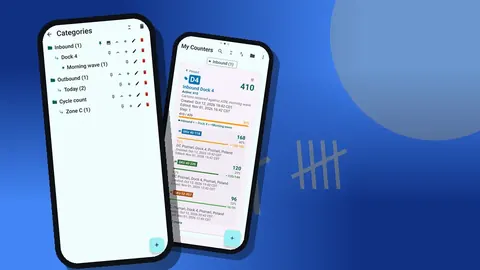
Marta installs Counter App on her own phone first and spends an afternoon building a structure. She uses the three category levels for Zone, Aisle and count type, gives each zone the same color as its floor signage, and pins the zone she plans to count first.
Within each aisle category, she creates a counter per bay. Inside each counter, tags for each location, named with the location code and SKU exactly as the inventory system writes them. Where bins carry printed codes, she stores them in each tag's barcode field. A pack-size step on a few tags lets her count cases while the value stays in units.
Then she makes a backup ZIP of the structure and imports it on the phones of two team leads. The import preview shows what will arrive and offers replace, copy or skip for duplicates. There is no live sync between phones, so each lead will count their own areas.
The first counts
The first week is deliberately small: two aisles near the dock, counted every morning before picking starts.
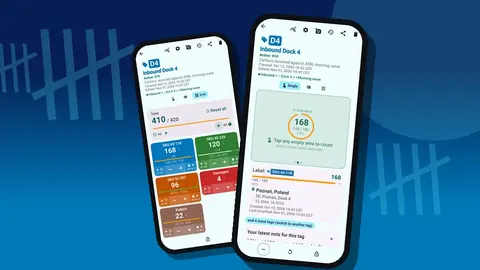
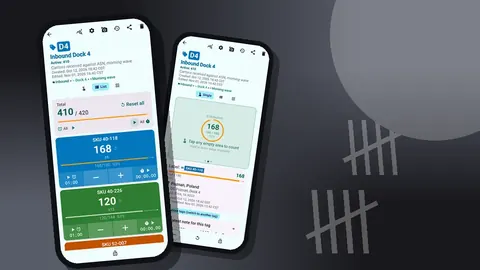
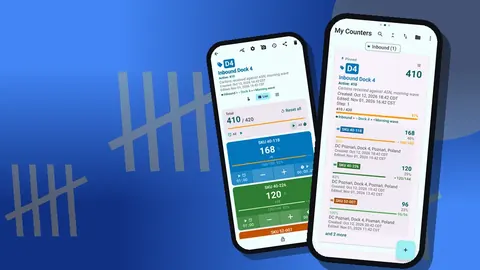
The leads open each bay's counter in List view. Each location is a row with − and + buttons and its value; total versus target sits at the top. Marta asks them to run blind counts, without targets, so nobody stops at the expected number. She also asks for one habit above all: when a count surprises you, recount it and leave a note on the event.
One of the leads finds the volume buttons useful for the long runs of identical cartons. With volume-button counting enabled in settings, the keys count with the phone in a pocket, each with its own sound and vibration, which leaves both hands free to shift cartons.
At the end of each morning, the leads lock their counters and export a summary with notes as an Excel file. Marta pastes the files into a workbook next to the system quantities and looks at the differences over coffee.
What the data starts to show
After a few weeks, the notes say more than the numbers. Scrolling the All Notes screen, which lists every note with its tag and time, Marta sees the same phrases repeating:
- "Pallet still wrapped, not put away."
- "Two SKUs in one bin."
- "Count matches if the staging pallet is included."
In this scenario, a good part of the variance near the dock is not loss at all. It is stock that has been received in the system but is physically still in staging, or was put away into the nearest empty bin instead of its assigned one. The mirrored pairs from January suddenly make sense.
None of this needed a sophisticated tool. It needed counts frequent enough that the cause was still visible, and a place to write down what the counter saw.
Fixing the dock
Marta looks at the history of a few problem tags. Every event shows its exact time and the value before and after. Comparing those times with receiving bookings, she can see that some bins are counted while their stock is still on the dock, booked but not yet moved.
The fixes are procedural:
- Staging becomes its own zone, with its own counter, counted daily. Stock there is no longer invisible.
- Putaway is confirmed to a scanned location, not to "any free bin".
- Receivers photograph short or damaged cartons on the delivery's counter before signing, and note the shortage.
Within the scenario, the dock aisles begin to settle. Variances do not disappear, but they become small and explainable rather than large and mysterious.
Making it routine
With the dock under control, Marta extends the program across the building using a simple class system: the highest value and fastest moving locations every month, the middle tier every quarter, the long tail twice a year. A spreadsheet calendar produces each day's short list, and the leads pin the day's counters on their phones.
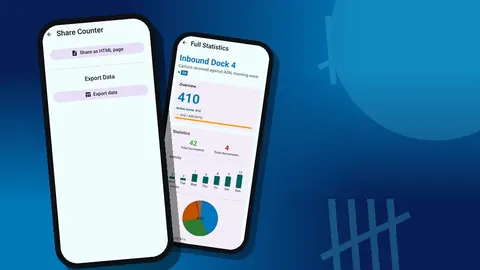
Each Friday, she checks the dashboard of a few counters. You see the total against the target, increments versus decrements, a bar chart of the last seven days and a pie chart by tag. A week with a flat activity chart in one zone is an early sign that the calendar is slipping there, long before it shows up as a variance.
Backups become a monthly habit. Because count data is stored on the phone, with no account and no Counter App cloud, a ZIP backup with compressed photos goes to the team's shared records each month.
What changes, and what does not?
By the next January in this scenario, the annual count still happens, because the auditors want it. It is shorter, less dramatic, and the correction it produces is smaller, because most of the drift has already been caught and explained during the year.
What does not change is just as important:
- The inventory system stays the system of record. The phones count; the system holds the books.
- People still make errors. The difference is that errors are found within days, while there is still a chance to learn why.
- The tool is not the improvement. Frequent counts, honest notes and fixing root causes are the improvement. The phone just makes them cheap enough to do every day.
The weekly export is the hinge between floor and office. Summary and Notes, exported as CSV or Excel, go into the same workbook every week, and the trend lives there.
Which objections might Marta hear?
Changes like this meet resistance, and in our scenario Marta hears three objections more than once.
"We do not have time to count every day." The answer is the size of the list. A short daily list of locations takes part of one person's morning, which is far less disruption than a weekend shutdown. Marta also lets the leads choose the quiet hour for counting.
"Phones are for personal use." Some team members are uncomfortable installing a work app on a personal phone. Marta can point out that there is no account and no Counter App cloud, and the counts are kept on the phone, but she also buys two inexpensive shared phones for those who prefer not to use their own.
"The system is right, the pickers are wrong." Sometimes it is. The notes and the history help settle that without blame, because they show what was on the shelf at a given time rather than who remembers what.
None of these objections disappears entirely. What helps most is that the first weeks of counting produce fixes people can see, especially at the dock.
Lessons from the scenario
If you recognize Marta's January, a few ideas from this sketch may transfer:
- Start from the variance report, sorted by value, and count where the money is.
- Start small: two aisles counted daily teach more than the whole building counted once.
- Prefer blind counts, and make recounts and notes a rule rather than a suggestion.
- Treat staging and returns as real zones with their own counters.
- Look at notes before numbers; the cause is usually written there.
- Keep the export routine boring and regular.
For the mechanics behind this scenario, see how to run cycle counts, freight receiving counts with a phone and exporting counts to a spreadsheet.
On Android 12 and later, the app is free to download with no ads; try it free for 3 days, then choose a yearly or monthly plan or a one-time lifetime purchase. Get the app at counterapp.online.
Frequently asked questions
Is this warehouse manager story a real customer case?
No. It is an illustrative scenario built to show a realistic process. The people, the warehouse and every number in it are invented examples.
Can several people count at the same time?
Yes, each on their own phone and their own counters. There is no live sync between phones, so results are combined from the exports, and structure is shared with a backup ZIP.
Does the app work in warehouse areas without signal?
Yes. Daily cycle counts near the dock or on the mezzanine run offline, and the app only uses the internet for optional notifications, update checks and map tiles.
What does the counting app cost a warehouse team?
Counter App — Tally & Clicker is free to download with no ads; try it free for 3 days, then choose a yearly or monthly plan or a one-time lifetime purchase, with details at counterapp.online.
Where is the warehouse count data stored?
On each counting phone. There is no account and no Counter App cloud, and backups are ZIP files the team keeps itself.
Why did the manager in the scenario ask for blind counts?
Without targets, a team lead cannot stop at the expected number, so every recorded count is an independent observation for reconciliation.
Does the annual count disappear in the scenario?
No. The annual count still happens because the auditors want it, but it is shorter and produces a smaller correction.