Counter App

Shift Production Reports from Counter App Exports
Key takeaways
To build a shift production report from a counter app, record output per variant, rework, scrap, downtime and notes during the shift, check the dashboard, lock the counter, then export. Counter App — Tally & Clicker exports CSV, Excel or an HTML report with chosen sections; Summary plus Notes covers most daily reports.
- A shift production report is most reliable when output, rework, scrap, downtime and notes are captured in the counter during the shift.
- Counter App — Tally & Clicker exports CSV for master spreadsheets, Excel for direct reading and an HTML report with photos for phone review.
- Summary plus Notes is a sensible default for a daily shift report, with Events added when output per hour needs analysis.
- A shift counter should never be reset before its export has been sent.
A shift report is meant to describe what happened. Too often it describes what someone remembers at the end of a long shift, written in a hurry before the car park. A better template will not fix that. What fixes it is capturing data during the shift, so that the report is mostly assembled before anyone sits down to write it.
This guide covers the second half of that process: getting counts off the phone and into a shift production report that managers read and planners trust.
What belongs in a shift production report?
Start by listing what readers actually use. In most plants that is:
- units produced, total and per variant;
- rework and scrap;
- downtime events with duration and cause;
- notable events such as changeovers, material problems or staffing gaps;
- the state of the line at handover.
If a section never leads to a decision, drop it. A report that fits on one screen gets read; a four-page form gets filed.
Capture during the shift
Each line of the report should come from something already recorded in the counter. A mapping that works:
| Report item | Where it lives in Counter App |
|---|---|
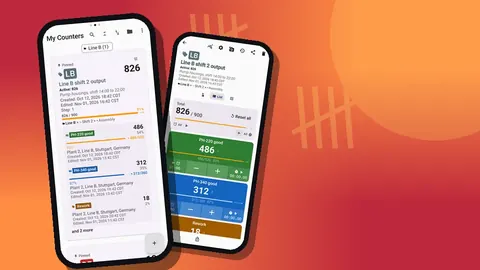
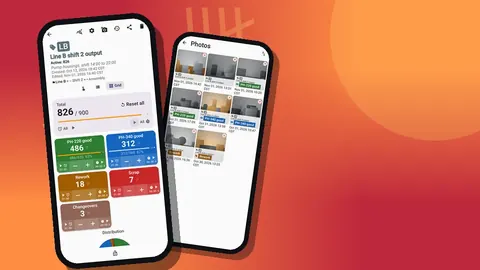
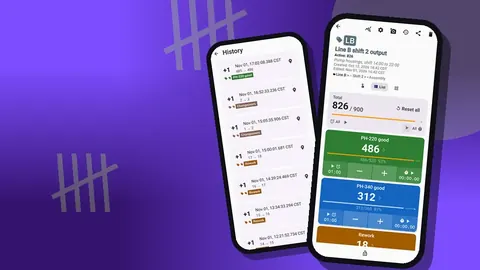
| Output per variant | One tag per variant |
| Rework, scrap | One tag each |
| Downtime duration | A tag's stopwatch, plus a note with the cause |
| Events | Notes on the relevant count event |
| Handover status | A note added at shift end |
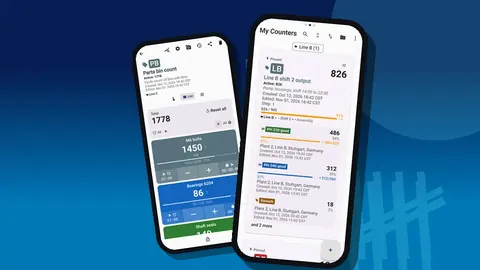
Create one counter per line per shift with a consistent name, such as "L3 Night 2026-10-27". Names matter more than they seem. Once exports pile up, the name is how you sort files, and inside the app the counter list's search, date-range filter and sort orders all depend on it.
Set steps and targets during setup rather than during the shift. A variant packed in boxes of 20 should have a step of 20; the shift plan becomes the target. Then the report's "planned versus actual" line is just the target and the total.
Notes are the narrative
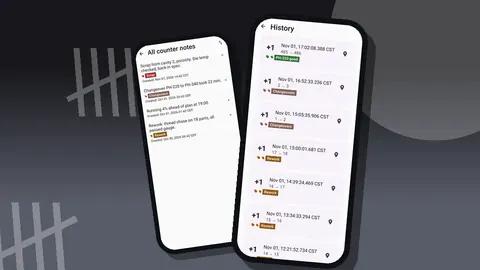
Numbers say how much; notes say why. Encourage team leads to add short notes to events as things happen: "die change start", "material short from stores", "new operator on station 3". Notes cost a few seconds at the time and save half an hour of reconstruction later.
The All Notes screen collects every note with its tag label and time, sortable. Before exporting, scroll through it once. It reads like the shift's diary and often reminds the lead of something worth adding to the handover note.
Check before you export
Two minutes of checking prevents most reporting errors. Open the dashboard and look at:
- the total against target: does it match what the lead believes?
- increments versus decrements: a high share of minus taps suggests corrections worth a note;
- the activity chart: long flat stretches should correspond to recorded downtime;
- the pie by tag: rework or scrap slices that look unusually large.
If something does not add up, open the history. It shows every tap with exact time and before and after values, so a stray entry can be found and corrected with a minus tap, which itself is logged.
Then lock the counter. Locking stops any change between the check and the export.
Which export format suits which reader?
Counter App exports in three formats, and each suits a different reader.
CSV is plain and universal. It is the right choice when shift data goes into a master spreadsheet or another system, because every file has the same structure and appending a new shift is a paste.
Excel (XLSX) suits a recipient who opens the file directly and wants readable columns without an import step, such as a manager reading on a laptop.
The HTML report is a single page that opens in any browser and embeds photos from the tags. It works well for a manager reviewing on a phone, or when pictures matter: a jammed feeder, a damaged delivery, a quality hold.
Picking sections
Each export lets you tick the sections to include:
- Summary: totals per tag, the core of any report.
- Events: every timestamped count, for analysing pace.
- Notes: the explanations, often the part managers value most.
- Locations: only relevant if tags store positions.
A good default for a daily report is Summary plus Notes. Add Events once a week, or when a shift needs a closer look.
Analysing the Events section
The Events section turns a total into a timeline. In a spreadsheet, group events by hour to see output per hour across the shift. Patterns that tend to show up:
- slow first hour after start-up or a changeover;
- a dip before and after breaks;
- a late-shift rush to reach target, often followed by more rework.
Each of these points to a different action, from start-up checklists to break staggering. None is visible in a single end-of-shift total.
Downtime can be estimated the same way: a gap between consecutive count events longer than the normal cycle, matched against notes, gives a downtime log without a separate form.
Rolling up the week
For a weekly view, collect each shift's Summary in one workbook. A layout that stays readable:
- one sheet for raw data, one row per tag per shift, with columns for date, line, shift, tag and value;
- one pivot sheet with lines down the side and days across the top;
- one chart of output and scrap per day.
Inside the app, the counter list's date-range filter narrows to the week and the sort menu orders counters by name or date, so it is easy to confirm that every shift was exported. Pin the current week's counters to keep them in reach.
Archiving and moving data
Shift counts are stored on the phone, with no account, no Counter App cloud and no live sync between phones. The export files you send are the record of each shift, so store them somewhere your plant already backs up.
For a copy of the counters themselves, make a backup ZIP. You choose which counters or categories to include and whether to compress photos. When moving to a new phone, importing the ZIP opens a preview with counts of what it contains and lets you replace, copy or skip duplicates. That is also the way to bring one line's counters onto a manager's phone for review.
How do you write a useful handover note?
The handover note is the one part of the report that cannot be counted, and it deserves a fixed structure. A short pattern that incoming leads can scan in seconds:
- State: running, stopped or in changeover, and which variant is on the line.
- Open issues: anything unresolved, such as a gauge awaiting calibration or a material shortage.
- Watch points: things the next shift should keep an eye on, for example a fixture that started to drift.
- Requests: maintenance or stores actions already raised, so they are not raised twice.
Add the note to the counter at the end of the shift, before locking. Because notes travel in the Notes section of every export, the same text reaches the manager's report and the incoming lead's phone without being typed twice.
Keep the note factual. "Feeder jammed twice, maintenance checked belt, running normally since 21:40" helps the next shift. "Bad night" does not.
Common reporting mistakes
A few errors appear again and again when teams move from paper to exported reports:
- Resetting before exporting. Once a counter is reset, its totals are gone from the counting screen. Make the export the first step, every time.
- Inconsistent counter names. "L3 night", "Line 3 N" and "L3-Night" sort into three different places. Agree on one pattern and write it down.
- Mixing units. If one shift counts boxes and another counts pieces on the same tag, the weekly roll-up is meaningless. The step setting exists to keep the unit constant.
- Missing notes on minus taps. A correction without an explanation looks like tampering to anyone reading the Events section later.
- Several phones counting the same line. Without live sync, two phones produce two partial records. Assign one official phone per line and shift.
- Sending the wrong sections. A manager who wanted the narrative and received only Summary will ask for the report again. Agree on the default sections once.
Adapting the report to different readers
Not every reader needs the same file. Planners want totals against plan, usually the Summary in CSV pasted into their own sheet. Maintenance wants the downtime story, which lives in Notes and in the gaps of the Events section. Quality wants rework and scrap with photos, which the HTML report delivers best. A plant manager often wants a single page, and the HTML report again fits, because it opens on any phone without an app.
Rather than one report that tries to please everyone, export twice when needed. Each export takes a few taps, and each reader gets exactly the sections they use.
A simple end-of-shift routine
- Add the handover note.
- Check the dashboard and history for obvious errors.
- Lock the counter.
- Export Summary and Notes as CSV, or an HTML page if there are photos to show.
- Send the file to the agreed recipient.
- Reset or start the next shift's counter only after the export is sent.
Five minutes at the end of a shift, and the report writes itself from the record rather than from memory.
Every shift report above comes from Counter App — Tally & Clicker by GiveMeMood, an Android 12+ app that is free to download with no ads; try it free for 3 days, then choose a yearly or monthly plan or a one-time lifetime purchase. Get the app at counterapp.online.
Frequently asked questions
Which file formats can a shift production report be exported in?
A shift counter exports as CSV, Excel (XLSX) or an HTML page with photos embedded, with Summary, Events, Notes and Locations as optional sections.
Are times recorded for each count?
Yes. Each tap during the shift is logged with its exact time, and a lead can attach a note to any single event.
Can I export several lines at once?
Each counter is exported as its own report. To move many counters between phones, the ZIP backup lets you pick counters or categories and includes photos.
Does Counter App upload shift data to a server?
Counter App has no account and no Counter App cloud; shift data is stored on the phone, and the export file is what you send. If Android device backup is switched on, the system may copy app data to the user's Google account.
Can I record downtime in the report?
Use a tag's stopwatch to time the stop and add a note to the event with the cause. Both appear in the Events and Notes sections.
How can downtime be estimated from the Events section?
Look for gaps between consecutive count events that are longer than the normal cycle and match them against the notes. That gives a rough downtime log without a separate form.