Counter App

Quality Control Counter for Manufacturing Inspection
Key takeaways
A quality control counter for manufacturing makes recording inspection detail as fast as recording the total. In Counter App — Tally & Clicker, an inspection counter holds Inspected, Pass, Fail and defect-category tags, sample-size targets with auto-lock, and up to six photos per tag. Export the Summary to calculate first-pass yield and defect rates.
- A quality control counter should record units inspected, passed and failed, plus defects by category.
- Inspectors must decide in advance whether defect tags count units or defect occurrences, and write the rule into the counter description.
- Counter App — Tally & Clicker can stop a sampling inspection at the sample size with a target, an alert and auto-lock.
- Counter App does not calculate yield; first-pass yield is Pass divided by Inspected in an exported spreadsheet.
An inspector at the end of a line does two jobs at once: looking at parts and recording what was seen. Each second spent hunting for the right column on a paper sheet is a second not spent on the part. That is why inspection records so often end up as one headline number, with category detail "filled in later", which in practice means guessed.
A quality control counter on a phone will not make anyone a better inspector. What it can do is make recording the detail as fast as recording the total, so the detail actually gets captured. This article sets out a practical inspection setup in Counter App on Android.
What numbers should a QC inspection produce?
Most QC checks produce at least four figures:
- Units inspected, the denominator for every rate.
- Units passed.
- Units failed.
- Defects by category, such as dimensional, cosmetic, functional or missing component.
Figures 3 and 4 are not the same thing. A single failed unit may carry two defects, and a passed unit may carry a minor cosmetic mark you still want to log. Decide before the first run whether category tags count units or defect occurrences, and write that decision into the counter description where every inspector will see it. Inconsistent rules here are the most common reason two inspectors on the same product produce different rates.
Building an inspection counter
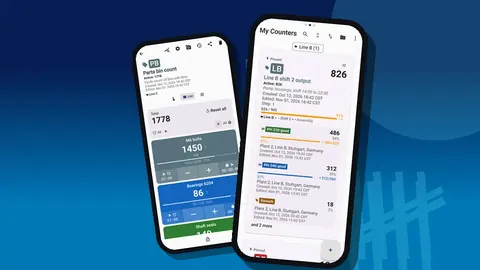
Create one counter per inspection run, named with the product, line and date, for example "PH-220 final QC Line B 31 Oct". Use the code field for a short badge. Place inspection counters in the same category as the output counters for that line, so the counter list shows production and quality side by side.
Inside the counter, add tags:
- Inspected
- Pass
- Fail
- one tag per defect category
If you prefer one long-running counter per product instead of one per run, export and reset at the end of each run. Either way works; the important thing is that each run's data can be separated later.
Defect tags that inspectors can trust
Defect categories need names that leave no room for interpretation. "Cosmetic" is too broad if it covers both a fingerprint and a deep scratch. "Scratch > 1 mm" and "Surface mark" are better. Keep the list short enough to fit on one screen in Grid view, usually six to eight categories, and include an "Other" tag that someone reviews every week.
Give Pass a calm color and defect categories stronger ones. On a busy bench, color is read faster than text. If parts or lots carry a label, a tag can hold a barcode or QR code, scanned or typed, so the record carries the part or lot code.
Step stays at 1 for most QC work. Larger steps, up to 100, only make sense if you accept or reject entire lots and want one tap per lot.
Sample-size targets
For sampling inspection, put the sample size as a target on the Inspected tag. When it is reached, the app can sound or vibrate, and auto-lock stops the tag from creeping past the sample by accident. If you run repeated samples of the same size through the day, auto-reset returns the tag to zero after each one, although then you must export or note each sample before it resets.
Targets can also count down. Some inspectors prefer to see "12 left" rather than "38 of 50", which is purely a matter of taste.
During inspection
The tap sequence
A routine that works for most benches:
- Tap Inspected as the part is picked up.
- Tap Pass, or tap Fail followed by every relevant defect category.
- Put the part in the right bin before picking up the next one.
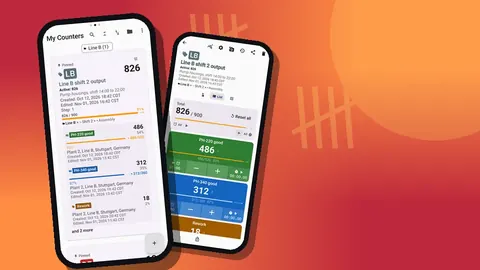
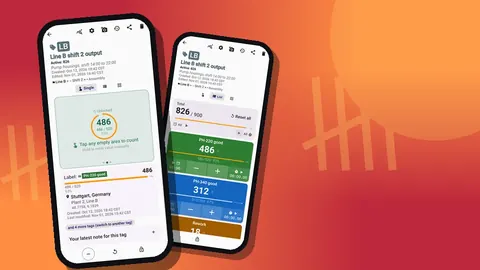
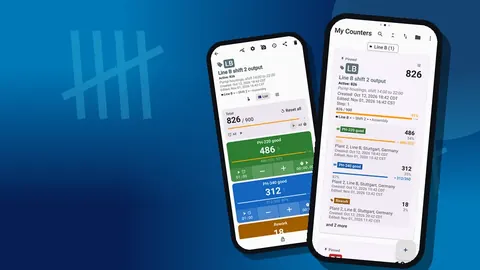
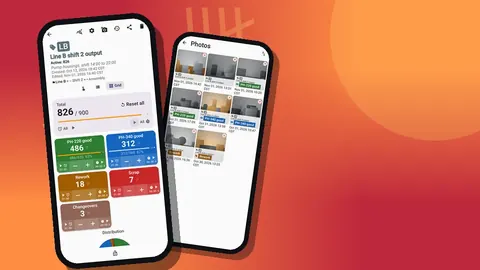
The order matters less than doing it the same way every time. Grid view is usually the best layout, with a colored tile per tag and large buttons. List view is a good alternative when there are many categories and you want to see inspected, pass and fail totals in one column. The tag display can be collapsed except the most recent tag, which keeps the screen tidy while leaving the last category touched in view.
If gloves make screen taps unreliable, enable volume-button counting in settings. It is off by default. The keys can be remapped and given their own sound and vibration, so the two most frequent actions can be done without looking. It also works with the screen locked. Some devices still display the volume bar during use.
Corrections
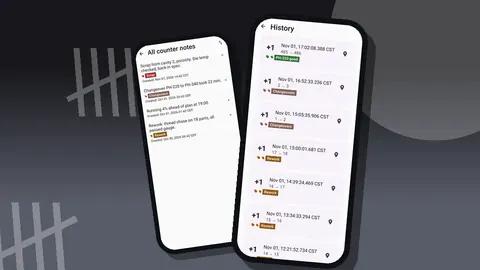
Mistakes happen. Tap minus on the wrong tag immediately rather than adjusting at the end. The history records both taps with their times, so an auditor can see the correction instead of a silent change. If the counter will sit on the bench while you step away, lock it so a sleeve or a part cannot add counts.
Photo evidence
When a defect will be discussed later, photograph it from its tag. Each tag holds up to six photos, so pick representative examples instead of photographing every reject. The photo editor lets you rotate, draw with a brush, and add text in six colors with four fonts and bold, italic, underline or strikethrough. A quick circle and a dimension label make the photo meaningful to a supplier or engineer who never saw the part.
Finding the pictures later
The all-photos gallery shows the photos in a grid with their tag labels and dates. In a supplier quality meeting this is the fastest way to answer "show me what you found" without searching through a phone's camera roll.
Notes on events
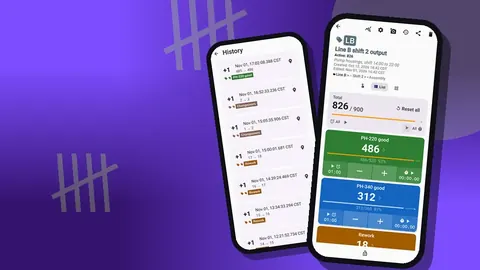
History logs every tap with an exact timestamp and before and after values. A note can be added to any event: "gauge recalibrated", "new resin lot", "operator changed". The All Notes screen collects them across the counter, with sorting. Notes are often what explain a sudden jump in a defect category.
After the run
Reading the run
The dashboard shows the overall total and target, increments versus decrements, a seven-day activity chart and a pie chart by tag. For QC, the pie chart gives an immediate picture of which defect categories dominate this run. If the same slice grows run after run, start the investigation there.
The dashboard does not calculate yield or defect rates. That is deliberate in the sense that the right formula depends on your rules, units or occurrences, which the app cannot know.
How do you calculate first-pass yield from the export?
Export the counter from the share screen as CSV or Excel. In the export options, Summary gives totals per tag, which is all that rates need:
- First-pass yield = Pass / Inspected.
- Failure rate = Fail / Inspected.
- Defects per unit = sum of defect category tags / Inspected, when categories count occurrences.
Events adds every timestamped tap, which lets you check whether defects cluster at certain times, for example the first hour after start-up. Notes and Locations add context. For managers who will not open a spreadsheet, an HTML report with photos embedded can be shared instead.
Building a quality history
Single runs are noisy. Paste each run's Summary into one spreadsheet, one row per run, and chart yield over time. Use the counter list's date-range filter and six sort orders to find all runs for a product in a period; search finds one by name.
Inspection data is held on the inspection phone, with no account and no Counter App cloud. If two inspectors work in parallel on separate phones, each exports separately and the spreadsheet combines them. A backup ZIP, optionally with compressed photos, keeps a copy of the inspection history or moves it to a new phone.
A quality history is easier to read when each product family has its own category. Categories nest up to three levels, so a plant can group inspection counters by product line, then by part, then by inspection stage. Pinning the category for the current run keeps it at the top of the list for the whole shift.
How do you keep several inspectors consistent?
When several inspectors check the same product, their numbers should be comparable. Three practices help. First, run a short calibration session: two inspectors check the same ten parts on separate counters and compare the Summary exports; any category where they disagree needs a clearer definition. Second, keep reference photos of borderline defects on the relevant tags, so an inspector unsure about a mark can compare it on the spot. Third, review the "Other" tag weekly and either fold its contents into an existing category or create a new one.
Rotation also matters. An inspector who has looked at the same part for hours starts to miss things. If rates drop late in a shift, check the Events timestamps before concluding that quality improved.
A checklist for a new inspection setup
- Write the units-or-occurrences rule into the counter description.
- Keep defect categories specific and few.
- Set the sample size as a target with auto-lock.
- Choose Grid or List view and stick with it.
- Lock when away from the bench; correct with minus straight away.
- Export the Summary after every run.
Counter App — Tally & Clicker, made by GiveMeMood for Android 12+ phones at the inspection bench, is free to download with no ads; try it free for 3 days, then choose a yearly or monthly plan or a one-time lifetime purchase. Get the app at counterapp.online.
Frequently asked questions
Can I photograph a defective part during inspection?
Yes. Each tag can hold up to 6 photos, and the photo editor lets you draw or add text to mark the defect.
Does the app calculate defect rates for me?
The dashboard shows per-tag totals, progress and a pie chart of the split. For a formal rate, export to CSV or Excel and divide defects by units inspected.
Can I count a sample size and stop at the right number?
Yes. Set a target on the inspected tag. The app can alert with sound or vibration and auto-lock the tag when the sample size is reached.
Can I tie an inspection to a part label?
A tag can store a barcode or QR code, scanned with the camera or typed manually, so the inspection counter can carry the part or lot code.
Can a QC inspector record results while wearing gloves?
Grid view gives every inspection tag a large tile. Volume-button counting can also be switched on in settings for glove-friendly counting.
Should QC defect tags count failed units or defect occurrences?
Either works, but every inspector must use the same rule. One failed unit can carry two defects, so write the chosen rule into the counter description.
How can two inspectors check they judge defects the same way?
Have both inspect the same ten parts on separate counters and compare the Summary exports. Any category where they disagree needs a clearer definition.