Counter App

Defect Tracking Counter App for Manufacturing Teams
Key takeaways
A defect tracking counter app replaces free-text defect notes with counts: one tag per defect type, one tap per defect at the point of detection. In Counter App — Tally & Clicker on Android, each tap is timestamped, notes and photos add context, and a CSV or Excel export lets you rank causes and check whether a fix worked.
- A defect tracking counter works best with a fixed list of six to ten defect types plus an Other tag reviewed weekly.
- Counter App — Tally & Clicker logs every defect tap with a timestamp, so a corrective action can be checked against the counts before and after it.
- The Counter App dashboard shows a pie chart by defect type and a seven-day activity chart, but no Pareto chart; ranking is done in an exported spreadsheet.
- Each defect tag in Counter App can hold up to six photos, marked up with a brush and text in the built-in photo editor.
Most plants already know which defects they have. What they rarely have is a number next to each one. A defect that shows up in a shift log as "some scratches again" cannot be compared with last month, cannot be ranked against porosity or burrs, and cannot prove that a corrective action worked. A defect tracking counter app closes that gap with very little ceremony: an operator or inspector taps a tag each time a defect type appears, and the phone keeps the timestamped record.
This guide shows how to set that up in Counter App on Android, how to keep the data clean during the shift, and how to turn the counts into a ranked list of causes once a week.
Counting first, describing second
The common failure of defect logs is that they start as free text. Free text is easy to write and nearly impossible to total. The fix is to agree on a short, fixed list of defect types before anyone counts, and to treat descriptions as an extra layered on top of the count rather than a replacement for it.
A useful rule on the floor: if a defect happens, it gets a tap. If it is unusual, it also gets a note. That keeps the count complete even on a hectic shift, while still giving engineers the context they need for the odd cases.
Design the category list
Start with the categories, because they decide how the data rolls up later. Counter App allows up to three nesting levels, which maps well onto plant structure. One sensible layout looks like this:
- Level 1: the area, for example "Line B" or "Quality".
- Level 2: the product family or the work cell.
- Level 3: the time bucket, such as a week number, if you prefer one counter per week.
Categories can have custom colors and can be pinned, so the line you care about most this month sits at the top of the list. Avoid going deeper than you need. Two levels is enough for many sites; three helps when one quality engineer covers several lines.
For the defect types themselves, aim for six to ten. Fewer than five usually hides real differences. More than twelve means operators hesitate over which tile to hit, and hesitation produces miscounts. Keep an "Other" tag for things that do not fit and review it weekly: anything that keeps appearing there deserves its own tag.
Setting up the defect counter
Create one counter per line and period, for example "Line B defects week 44". Give it a short code in the initials field so it stands out in the list. Inside it, add one tag per defect type: Scratch, Dent, Burr, Porosity, Wrong label, Missing part, Other.
Each tag has its own color. Pick colors that match any visual standard you already use on boards or tote labels, so operators do not have to learn a second scheme. The step stays at 1 for defects in most cases, because each defect is an individual event. If you do inspect in fixed lots and want to log a whole lot as rejected, a tag can use a larger step, anywhere from 1 to 100.
A target is optional for defects. Some teams set a tolerance ceiling on each tag, for instance 20 scratches a week, and switch on a vibration alert when it is reached. That turns the counter into an early warning: the inspector feels the phone buzz and knows to call the supervisor before the week is out, rather than discovering the problem in a Friday review.
If parts carry a label, a tag can also store a barcode or QR code, scanned with the camera or typed by hand. That is handy when defects are logged per part number instead of per defect type.
How should operators log defects during a shift?
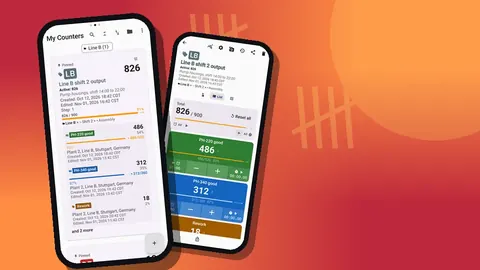
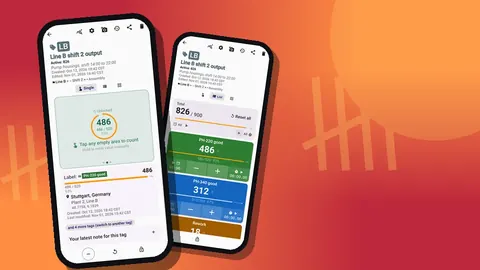
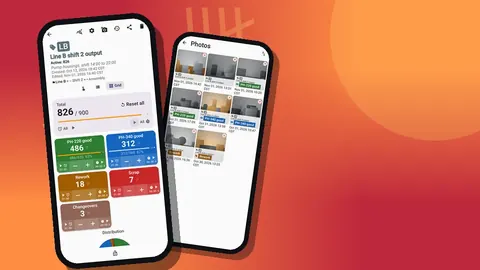
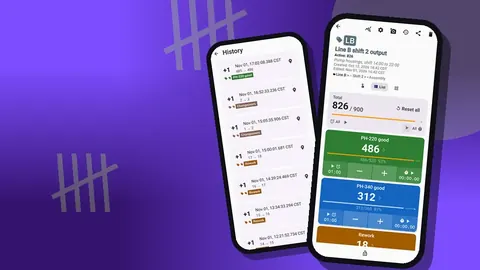
Switch the counting screen to Grid view for defect logging. Each tag becomes a colored tile with its value, target progress and large minus and plus buttons. On a noisy floor, with gloves on, big targets matter more than anything else.
A few habits keep the numbers honest:
- Count at the point of detection. Batching taps until the end of an hour invites rounding and forgotten defects.
- Use minus to correct, never to "net off". If a part was wrongly flagged as a scratch, remove that tap; do not subtract scratches because a part was reworked successfully. Rework belongs in its own tag or counter.
- Lock the counter when stepping away. A locked counter ignores taps, so a phone in a pocket or on a bench cannot add phantom defects.
- Hand over explicitly. At shift change, the outgoing inspector glances at the totals and tells the incoming one; both keep counting into the same weekly counter.
For inspectors who keep the phone in a holster, volume-button counting is worth testing. It is off by default; once enabled in settings, the keys add or remove a step even when the screen is locked, and they can be remapped with their own sound and vibration. Some devices still show the system volume bar while doing this.
Evidence: notes and photos
Counts tell you how often; notes and photos tell you what it looked like. Each tag can hold up to six photos, and the photo editor lets you rotate the image, draw with a brush, and add text in six colors and four fonts. A quick red circle around the scratch and a two-word label ("fixture edge?") makes the photo useful to someone who was not there.
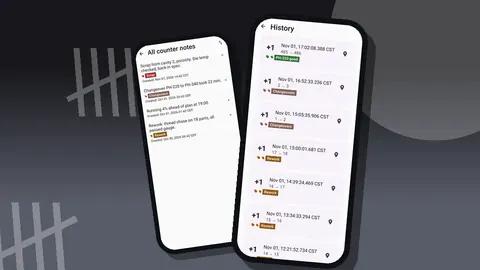
Notes can be attached to individual events in the history, which is the right place for short context such as "after die change" or "batch from supplier lot 3". The All Notes screen collects every note across the counter with its tag label and time, sortable, which makes the weekly review much faster than scrolling through raw history.
Do not photograph every defect. Photograph the first of each new kind, the worst example of the week, and anything that might become a customer complaint. Six photos per tag is a natural limit that forces you to keep the best evidence.
Reading the trend
Daily counts are noisy. The trend becomes visible once you look at a full week, and actionable once you compare several weeks.
Weekly review
Open the dashboard for the weekly counter. It shows the overall total against any target, increments versus decrements, a seven-day activity bar chart and a pie chart split by tag. The pie answers "which defect types dominate?" and the bar chart answers "which days were bad?". If decrements are a large share of activity, that is a signal that people are correcting a lot of taps, which may mean the tag list is confusing.
A fifteen-minute review agenda that works well:
- Top three tags by count and whether they changed from last week.
- Any tag that crossed its tolerance target.
- The "Other" tag: read its notes and decide whether a new tag is needed.
- Photos added this week, viewed in the photo gallery.
Comparing weeks
When each week is a separate counter with a consistent name, the counter list does the comparison work. Use the date-range filter to show only the last month, and one of the six sort orders to line counters up by name or date. Search finds a specific week if the list is long. Pinned counters stay at the top, so the current week is always one tap away.
Keep names predictable, such as "Line B defects wk43", "wk44", "wk45". Since history has no search of its own, a good naming scheme is what keeps old data findable.
How do you rank defect causes without a Pareto chart?
The app does not draw a Pareto chart, and it does not need to. Export the counter to CSV or Excel from the share screen. In the export options you choose the sections: Summary gives per-tag totals, Events gives every timestamped count, Notes and Locations add context.
For a Pareto ranking, the Summary section is enough. In the spreadsheet, sort tags by count descending, add a running total column, and divide by the overall total for the cumulative share. The two or three tags that account for most of the defects are where engineering time should go. Using Events instead lets you pivot by day or by hour, which helps when a defect clusters around start-up or a particular operator rotation.
How can you tell whether a corrective action worked?
A corrective action is a hypothesis. The counter is how you test it. When a fix goes in, say a new fixture pad to stop scratches, add a note to the event log at that moment: "new pad fitted 10:40". Then keep counting exactly as before.
After a few shifts, the history shows every scratch with its timestamp and before and after values, so you can see whether the rate dropped after 10:40. For a cleaner comparison, start a fresh counter on the day of the change and compare like-for-like periods: the same number of shifts, the same product mix. Resist the urge to declare victory after one quiet shift; defect rates swing with volume and with which variants ran.
If the fix did not work, the data still pays off. You have ruled out one cause with evidence instead of opinion, and the note in history explains why the next fix was tried.
Sharing with the wider team
Not everyone needs a spreadsheet. The share screen can produce an HTML page with embedded photos, which opens in any browser and is ideal for a weekly email to the plant manager or a supplier. For engineers, a CSV or Excel file with Events and Notes is more useful.
The defect log is stored on the inspector's phone, with no account and no Counter App cloud, and two phones never sync live. If two inspectors on different phones count the same line, export from each and combine the files, or move counters with a backup ZIP. Agree on who owns the official weekly counter so totals are not double-counted.
How this connects to inspection and production
Defect counts mean most when they sit next to output. Ten scratches out of fifty parts is a crisis; ten out of five thousand may be within tolerance. Keep a separate counter for units produced or inspected on the same line, and export both at the end of the week. Dividing defects by units gives a rate you can track over time, and that rate is what customers and auditors usually ask for.
The same category structure works for both. Put "Line B output" and "Line B defects" under the same Line B category so a single glance at the list shows the pair.
Summary
Keep the defect list short and fixed, count at the moment of detection, and attach notes and photos only where they add context. Review the dashboard weekly, compare weeks through consistent counter names and the list filters, and rank causes from an export. When a fix goes in, mark the moment in history and let the counts show whether it worked.
Built by GiveMeMood for Android 12+, Counter App — Tally & Clicker is free to download with no ads; try it free for 3 days, then choose a yearly or monthly plan or a one-time lifetime purchase. Get the app at counterapp.online.
Frequently asked questions
Can I filter counters by date to compare weeks?
Yes. The counter list has a date-range filter, search and six sort orders. History itself has no search, so name counters clearly by week or run.
Does the app draw a Pareto chart?
No. The dashboard shows a pie chart and an activity bar chart. For a Pareto ranking, export to CSV or Excel and sort the categories in a spreadsheet.
Can I record where a defect was found?
Yes. A tag can store a GPS position, a point picked on a map, or a typed place name, and the export can include a Locations section.
Can I photograph a defect and mark it up?
Each tag holds up to 6 photos. The built-in editor adds brush strokes, text in 6 colors and rotation, so you can circle the flaw.
Does the defect log need a network connection?
No. Defect logging works fully offline, and the counts are stored on the inspector's phone with no account and no Counter App cloud.
How many defect types should a defect tracking counter have?
Six to ten defect types plus an Other tag is a workable range. Fewer hides real differences, and many more makes operators hesitate over which tile to tap.
Should a fixed defect be subtracted from the defect count?
No. Use the minus button only to undo a wrong tap. Successfully reworked parts belong in a separate Rework tag or counter so the defect total stays honest.