Counter App

Traffic and Pedestrian Counts on an Android Phone
Key takeaways
To run a manual traffic or pedestrian count on Android with Counter App — Tally & Clicker, create one counter per session or interval at each station and one tag per road-user class and direction. Tap each crossing of the screenline, add notes on conditions, then export timestamped Events to CSV and bin them into 15-minute intervals.
- A manual traffic or pedestrian count on Android can use Counter App — Tally & Clicker with one tag per road-user class and direction, shown as large tiles in Grid view.
- Every manual count in Counter App carries an exact timestamp, so the Events export can be binned into 15-minute or any other intervals after the session.
- Volume-key counting in Counter App suits two-category pedestrian counts, such as one key per direction, while classified vehicle counts still need the screen.
- Traffic count stations in Counter App can be recorded as typed station codes, GPS coordinates or map points, plus up to six photos per tag showing the screenline.
- Timestamped manual counts make it possible to validate an automatic traffic sensor by matching its own interval boundaries.
Automatic counters, cameras and loops are now common, but manual counts are still everywhere: validating automatic data, studying a junction before a scheme, counting pedestrians on a street where no sensor exists, or classifying road users more finely than a loop can. Manual counts are also how many students and community groups gather evidence for their local streets.
This guide covers running manual traffic and pedestrian counts on an Android phone with Counter App by GiveMeMood, from planning to a CSV ready for analysis.
What should be decided before a traffic count?
A good count is mostly decided at a desk. Settle these points before anyone stands at the kerb:
- Purpose. Validation, before-and-after comparison, peak-hour demand, or modal split.
- Classes. Which road users to separate: pedestrians, cyclists, cars, buses, goods vehicles, motorcycles, e-scooters. Keep the list to what you can reliably distinguish at speed.
- Directions and movements. One direction, both directions, or full turning movements at a junction.
- Time. Which days, which hours, and what interval length, often 15 minutes.
- Station. Exactly where the observer stands and which screenline they count across.
- Rules. For example, a cyclist walking a bike counts as a pedestrian, or a bus counts once per crossing regardless of occupancy.
Write the rules into a one-page brief. Ambiguity in the field leads to different observers counting different things.
Structure in Counter App
The app has categories, counters and tags.
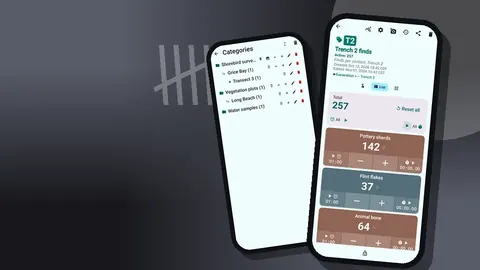
- Categories nest up to three levels: Survey → Day → Station, for example.
- Counters hold one session or one interval at one station.
- Tags are the classes you count, each with its own color, value and buttons.
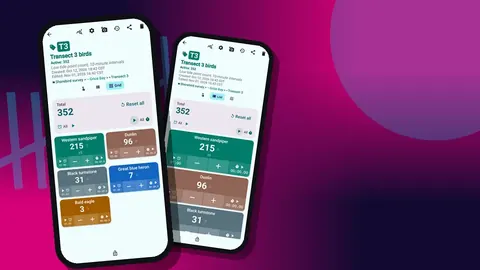
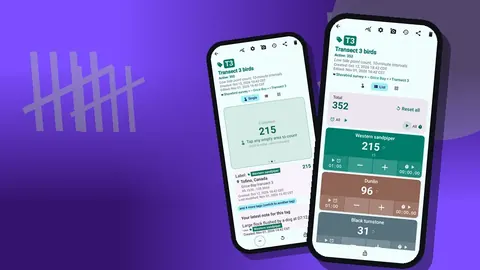
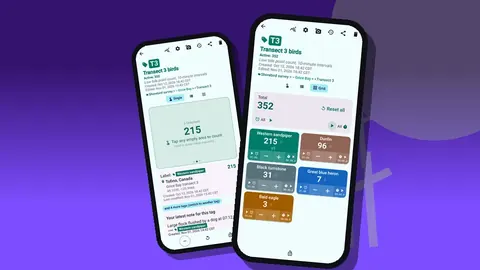
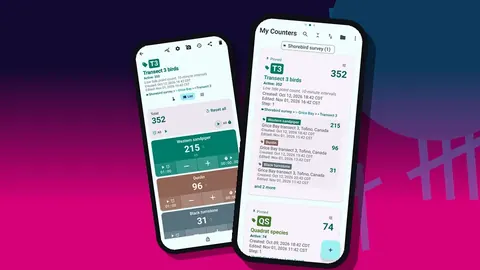
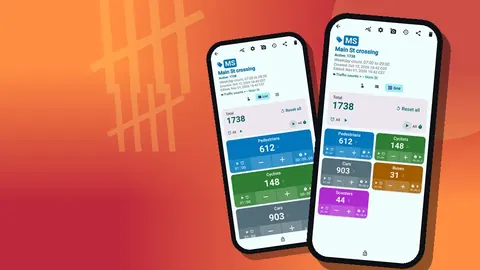
In List view, each class appears as a row with minus and plus buttons, its value and any target progress, with the counter total at the top. Grid view shows colored tiles, which are larger and easier to hit while watching traffic. Pick colors that are easy to tell apart in sunlight, and keep the order of tags the same at every station.
Directions as tags
For a two-way count, duplicate each class per direction: "cars N", "cars S", "cyclists N", "cyclists S". This doubles the tag count, so it works best with a short class list. For more complex counts, use a separate counter for each direction or approach.
Count stations and locations
Each tag can store GPS coordinates, a point picked on a map, or typed text. For traffic counts, a typed station code that matches your site plan ("ST03 Main St / Elm Rd east kerb") is clearer than coordinates in a report. GPS is a handy addition when stations are spread out and others may need to find them. Map tiles require internet, but typed locations and GPS do not.
Photos are useful here too. Each tag can hold up to six photos, so a quick shot of the station showing the screenline, edited with an arrow and label in the photo editor, makes the method reproducible next year.
Counting
At the station:
- Open the counter for the current session.
- Tap the matching tile or row for each road user crossing your screenline.
- Correct overcounts with minus; corrections are logged.
- Lock the counter at the end of the session.
Each tap adds the step. For most counts the step is 1, but platoons of pedestrians are sometimes counted in groups. If your method counts in fives, set that tag's step to 5 and note the convention in the brief.
Counting sounds can be distracting near traffic noise or irritating to passers-by. The app has 13 count sounds and 8 vibration styles; many observers prefer vibration only.
Counting busy pedestrian flows
Busy footways overwhelm screen tapping. Volume-key counting, off by default, lets you count with the physical keys. Map volume up to one direction and volume down to the other, each with its own vibration, and keep your eyes on the crossing. It works with the screen locked through a foreground service, and the lock-screen notification also offers minus, plus and stop. Some phones still show the system volume bar when a key is pressed.
Two keys give two categories, so this approach suits pedestrian counts by direction. Classified vehicle counts still need the screen.
How do you count traffic in 15-minute intervals?
Interval data is the backbone of traffic analysis. There are two practical approaches.
One counter per interval. Name counters "ST03 08:00", "ST03 08:15" and so on, inside the station's category. Switch counters at each boundary. This makes Summary exports directly usable but requires a quick switch every 15 minutes.
One counter per session. Count continuously and bin afterwards. Every event in history has an exact timestamp, and the Events export carries those times, so a short script or spreadsheet formula can sum counts into 15-minute bins. This is less fiddly in the field and lets you rebin into 5 or 60 minutes later.
Either way, a tag timer helps mark interval ends. Presets cover 30 seconds to 10 minutes, and other durations, such as 15 minutes, can be typed in. Countdown beeps and a choice of alarm sounds and vibrations signal the boundary.
Notes on conditions
Traffic counts are sensitive to conditions. Attach notes to count events as they happen: "bus stop blocked by delivery van", "rain started", "school crossing patrol on duty", "signals out of order 08:20 to 08:35". The All Notes screen lists them with tag labels and times, and the Notes section can be included in exports.
How do you count turning movements at a junction?
A full turning count at a four-arm junction has up to twelve movements per class. Doing that on one phone is hard. Common approaches:
- One observer per approach, each with a counter whose tags are left, ahead and right for each class.
- A reduced class list, for instance light vehicles, heavy vehicles and cyclists, to keep tags manageable.
- Collapsed tag display, or collapsed except the most recent, to save screen space.
Pilot any turning count on video first, because it is easy to overestimate how many movements one person can track.
Checking the log
Before leaving a station, open history. Each event shows time, step, before and after values, tag label and icons for notes. Look for gaps that do not match your break, or sudden bursts that might be pocket taps. History has no search, so check each session soon after it ends rather than auditing a whole day at once.
Reviewing the session
The dashboard summarises a counter: total and target, increments against decrements, a seven-day activity chart and a pie chart by tag. For a classified count, the pie chart is an instant modal split for that session, which is a useful sanity check against what you expected.
Exporting for analysis
Export CSV, Excel or an HTML report. In the export options, choose:
- Summary for totals per class;
- Events for timestamped counts, needed for interval binning;
- Notes for conditions;
- Locations for station references.
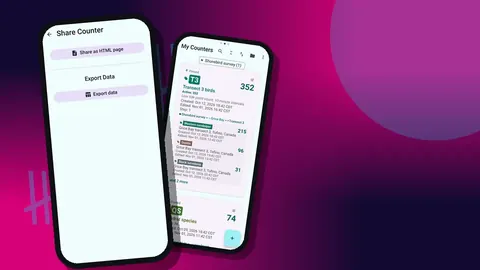
For analysis, CSV with Events and Locations is the most flexible. The HTML report, with station photos embedded, works well as an appendix in a short report. Counts are stored on the phone, with no account and no Counter App cloud, so export and back up after every session.
Multi-observer surveys
There is no live sync between phones. Give each observer their own station category and session counters, and use a shared naming pattern. At the end of the day each observer exports CSV and creates a backup ZIP, optionally limited to their category and with compressed photos. When a coordinator imports a ZIP, the preview shows its contents and offers replace, copy or skip for duplicates.
How can a manual count validate an automatic counter?
A common reason for manual counts is checking an automatic counter or sensor. The method is straightforward: count manually at the same screenline as the sensor, for the same periods, and compare interval totals.
Precise timing matters. Because every manual count carries an exact timestamp, the Events export can be binned to match the sensor's own interval boundaries, even if those are not on round quarter hours. Note the moment you start and stop, and record anything that might confuse the sensor, such as people stopping on the screenline or cyclists riding on the footway, as notes on the relevant events. Those notes often explain differences better than the totals do.
Keep the manual class list aligned with what the sensor claims to distinguish. Counting e-scooters separately is pointless if the sensor lumps them with cyclists, unless finding that misclassification is the purpose of the check.
Safety at the roadside
Stand well back from the carriageway, wear high-visibility clothing where your organisation requires it, and never step into the road to get a better view. Choose stations with a clear view of the screenline from the footway. Follow your local authority's or institution's rules for counting near traffic.
A hypothetical survey
Imagine a residents' group studying a crossing on Main Street before asking for a signal. Two volunteers count on a weekday morning from 07:30 to 09:30. One counts pedestrians and cyclists with volume keys; the other counts cars, buses and scooters on screen in Grid view. Each runs one counter per session, adds notes when a delivery van blocks the view, and exports Events at the end. A spreadsheet bins the counts into 15-minute intervals. The street, group and plan are invented for illustration.
Get the app at counterapp.online.
Frequently asked questions
Can different vehicle classes be counted at the same time?
Yes. Each class is a tag with its own plus and minus buttons, shown as rows in List view or as colored tiles in Grid view.
Can a traffic survey be counted in 15-minute intervals?
Use one counter per interval, or one counter per session and the timestamped Events export to bin counts into intervals afterwards. Tag timers can signal each interval's end.
Can a traffic counter record both directions of travel?
Yes. Create separate tags per class and direction, such as cars northbound and cars southbound, or separate counters per approach.
Can each traffic count station be recorded with its location?
Yes. Tags can store GPS, a point picked on a map, or typed text such as a junction name, and exports can include a Locations section.
Can pedestrians be counted with the phone's volume buttons?
Yes, once enabled in settings. The keys can be remapped, keep counting with the screen locked, and suit two-category counts such as pedestrians in each direction.
How many turning movements can one observer track at a junction?
A four-arm junction has up to twelve movements per class, which is hard on one phone. One observer per approach or a reduced class list keeps the count manageable.
How should a manual count be compared with an automatic traffic sensor?
Count at the same screenline for the same periods, then bin the Events export to the sensor's interval boundaries and compare totals, using notes to explain differences.