Counter App

Plant Counting in Quadrats: A Botanist Scenario
Key takeaways
A plant counting app such as Counter App — Tally & Clicker lets a botanist count flowering stems per species in each quadrat on an Android phone. Species become tags inside one counter per quadrat, nested under site, transect and visit, and the season's counts export as CSV for analysis in R or a spreadsheet.
- Counter App — Tally & Clicker can structure a quadrat plant survey as categories for site, transect and visit, with one counter per quadrat and one tag per indicator species.
- A plant counting app on Android is most useful for count-based protocols with a fixed species list, not for percentage cover estimates or open-ended species lists.
- Quadrat counts in Counter App export as CSV or Excel with optional Summary, Events, Notes and Locations sections, ready to reshape into a quadrat-by-species matrix in R.
- Locking a finished quadrat counter in Counter App prevents accidental taps from changing data while the phone is pocketed between plots.
- Counter App has no live sync, so a field assistant on a second phone shares counts through a backup ZIP that is merged with an import preview.
This is an illustrative scenario. Maren, her meadow site and every number below are invented to show a workflow. Nothing here reports real survey results.
Maren is a plant ecologist running a small monitoring project on a hay meadow that is being restored after years of heavy grazing. Her protocol is classic: fixed transects, permanent 1 m² quadrats along each one, and counts of flowering stems for a short list of indicator species on three visits across the season. For years she used a clipboard with a pre-printed grid. This season she decided to try counting on her phone with Counter App by GiveMeMood, while keeping a paper sheet as a backup for the first few visits.
What follows is how she might set things up, what goes smoothly, and what she has to change after the first day.
How should a quadrat survey be set up before fieldwork?
Maren spends an evening at her desk mapping the protocol onto the app before she ever kneels in the grass. The app gives her categories nested up to three levels, counters inside them, and tags inside each counter.
She settles on:
- Category level 1: the site, "Low Meadow".
- Level 2: the transect, "T1", "T2", "T3".
- Level 3: the visit, "Visit 1 May", "Visit 2 June", "Visit 3 July".
- Counters: one per quadrat, named "T1-Q01" through "T1-Q10".
- Tags: one per indicator species.
She pins the current visit's category so it sits at the top of the list. Counters can be duplicated for the next visit by importing a backup as a copy, but she prefers creating each visit's quadrats fresh, which forces her to check every name against the plot map.
A colleague suggests the opposite layout, with species as counters and quadrats as tags. Maren tries it on paper and rejects it, because her analysis treats quadrats as the sampling unit and each export row should be one quadrat.
Species tags and their settings
Each quadrat counter gets the same eight tags, in the same order, with the same colors: yellow rattle in yellow, knapweed in purple, bird's-foot trefoil in orange, and so on. Matching colors to flowers is a small trick that pays off later, when she is tired and reading the screen at an angle.
Every tag has its own step, value, optional target, timer, stopwatch, location, barcode and notes. For her stem counts the step stays at 1. For one grass she records in clumps of five, she sets that tag's step to 5 and writes "step 5 = one clump" into the counter description.
The tag location is typed text, "Low Meadow T1 Q01", because GPS on a phone is not precise enough to separate quadrats a few metres apart. She does store a GPS fix on the first quadrat of each transect as a rough anchor for anyone relocating the plots later.
A day in the field
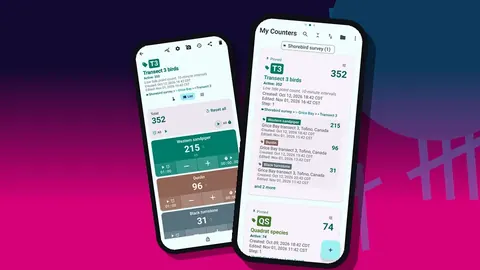
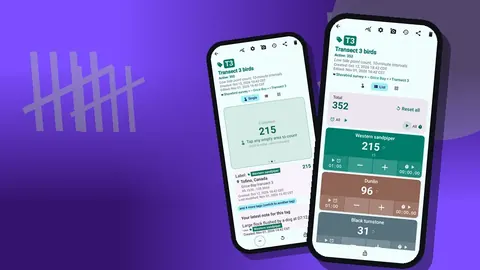
On the first visit, Maren works along T1 on her knees, frame in place. She opens the quadrat counter and uses List view, where all eight species sit as rows with their own minus and plus buttons and the running values.
For the most abundant species she switches to Single view. One big circular counter fills the screen and she taps without looking closely, eyes on the stems. The tag card below shows the location and the most recent note, so she can confirm she is in the right quadrat.
Counting with the volume keys
On the second day she enables volume-key counting in settings. It is off by default. She maps volume up to plus and volume down to minus, gives each its own short vibration, and keeps the sound muted. This lets her hold the phone in one hand and part the vegetation with the other. The counting continues even with the screen off, through a foreground service, and the lock-screen notification also carries minus, plus and stop buttons. On her phone the system volume bar still flickers briefly, which she learns to ignore.
Locking finished quadrats
When a quadrat is done she locks its counter. Kneeling, standing and pocketing a phone produces a lot of accidental touches, and a lock stops them from changing finished data. Unlocking takes a single deliberate tap.
Photos of tricky specimens
Some plants cannot be identified with confidence in the field. Maren photographs them on the relevant tag, which holds up to six photos. In the photo editor she draws a quick arrow with the brush, adds the quadrat code as text and rotates the image upright. Later, the all-photos gallery shows every image with its tag label and date, which makes it easy to send a batch of uncertain specimens to a colleague who knows the grasses better.
She attaches notes to individual count events as well: "two plants grazed, counted stems only" or "frame shifted 10 cm, re-placed". These end up in exports alongside the counts.
The evening routine
Back at the car, Maren runs a short check:
- Open the All Notes screen and read every note from the day, sorted by time.
- Open history for any quadrat with a surprising total. Each event shows the time, step, before and after values, tag label and icons for notes or photos.
- Compare a few totals with the paper backup sheet.
- Make a backup ZIP with photos, choosing only the current visit's category, and copy it to her laptop.
History cannot be searched, so she works quadrat by quadrat. On day one she finds a block of minus taps at the end of T1-Q04 that she does not remember. The timestamps show them landing while she was walking back to the car, which is exactly the problem locking solves, and from then on she locks every quadrat.
What went wrong on the first field day?
Three things trip her up early on.
The first is naming. On day one she types "T1Q1" on one counter and "T1-Q02" on the next. Sorting in the counter list puts them in an odd order, and she renames everything to a fixed zero-padded format that evening. The list offers six sort orders, and alphabetical sorting is only useful when names are consistent.
The second is screen glare. She raises the font scale, picks a high-contrast theme skin, and uses the larger size preset, after which she can read values in full sun.
The third is the temptation to add species on the fly. When she adds a ninth tag halfway through T2, the exports become ragged. Her rule now: new species go into a note, and the tag list only changes between visits.
Working with a field assistant
On the June visit a student, Theo, counts T3 on his own phone while Maren does T1 and T2. There is no live sync between phones, so the plan is simple. Theo works only in the T3 category, and at the end of the day he creates a backup ZIP of that category.
When Maren imports it, the preview lists the counters and asks how to handle duplicates: replace, copy or skip. Since T3 does not yet exist on her phone, nothing clashes. On a later visit, when both phones contain an older copy of T3, she chooses replace for Theo's fresher counters and keeps the ZIP files as a dated archive.
They also agree to swap phones for two quadrats and count them blind, then compare. That gives Maren a rough idea of observer differences without designing a formal study.
How can quadrat counts be compared between visits?
Between visits, the dashboard on each quadrat counter gives Maren a quick picture: the total, increments against decrements, a seven-day activity chart and a pie chart by species. The pie chart is not analysis, but it shows at a glance that T2-Q07 is dominated by one species while its neighbours are mixed, which prompts her to check the plot boundary on the next visit.
She does the real comparison in a spreadsheet, not on the phone, because visits live in separate categories and the app is not built for cross-visit statistics.
End of season: analysis
In August Maren exports each visit's counters as CSV. In the export options she ticks Summary and Locations, adds Notes for the record, and leaves Events off because she does not need every individual tap. The Summary gives one total per species per quadrat, and the Locations section carries her typed quadrat codes.
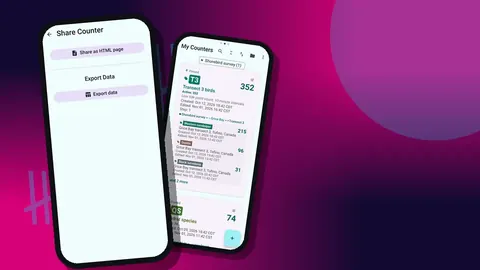
She loads the files into R, binds them by visit, and reshapes them into a quadrat-by-species matrix. An Excel export goes to the landowner, and an HTML report with embedded photos goes into the project archive, since it reads well without any software.
Would she recommend it?
In this scenario, Maren's verdict is cautious. She would use it again for count-based protocols with a fixed species list, and she likes that the counts are stored on her phone, with no account and no Counter App cloud. She would not use it for percentage cover estimates or for surveys where the species list is open-ended, and she still carries a pencil.
Practical details
- Runs on Android 12 or later and is free to download with no ads; try it free for 3 days, then choose a yearly or monthly plan or a one-time lifetime purchase.
- All counting works offline; map tiles and update checks use the internet when available.
- 37 interface languages, 10 fonts and 5 date formats.
- A counter removed by accident in the field can be recovered from the trash.
Get the app at counterapp.online.
Frequently asked questions
Is the botanist in this article real?
No. Maren is an illustrative character, and the site, species list and numbers are invented to show a workflow, not to report research.
Can each vegetation quadrat have its own stored location?
Yes. A tag can hold GPS coordinates, a point chosen on a map, or typed text such as a plot and quadrat code.
Can a plant counting app record percentage cover?
Counter App counts whole numbers with a step from 1 to 100. Some people use a tag value as a cover class or a percentage estimate, but it remains a counter rather than a dedicated cover tool.
How do quadrat counts get into R or a spreadsheet?
Export CSV or Excel and choose which of the Summary, Events, Notes and Locations sections to include. The CSV loads into R, Python or any spreadsheet.
Can a botany field assistant count quadrats on a second phone?
Yes, but there is no live sync. The assistant sends a backup ZIP or an export, and on import Maren decides whether duplicate counters are replaced, copied or skipped.
Why is typed text better than GPS for locating small quadrats?
Phone GPS is usually not precise enough to separate quadrats a few metres apart. A typed code such as "Low Meadow T1 Q01" identifies the plot reliably, with a GPS fix kept only as a rough transect anchor.
Can a grass recorded in clumps be counted with a different step?
Yes. Each tag has its own step from 1 to 100, so a clump-counted species can use a step of 5 while stem counts stay at 1.