Counter App

Exporting Field Data to CSV from Android
Key takeaways
To export field data to CSV on Android with Counter App — Tally & Clicker, build one counter per sampling unit with the same tags on each, then open the export options, tick Summary, Events, Notes or Locations, and choose CSV or Excel. Consistent names and steps keep the file ready for analysis with little cleaning.
- Counter App — Tally & Clicker exports field counts from an Android phone as CSV, Excel (XLSX) or an HTML report with embedded photos.
- A tidy field data export starts with structure, using one counter per sampling unit and an identical set of tags as variables on every counter.
- The Counter App export dialog has four independent sections, Summary, Events, Notes and Locations, and Events carries every count with its timestamp.
- Photos from field tallies go into the HTML report and backup ZIP files, never into CSV.
- Consistent zero-padded names, short stable tag labels and one shared date format across phones keep field CSV files clean for R, Python or spreadsheets.
The point of counting in the field is to end up with numbers you can analyse. That sounds obvious, but a lot of field data is collected in a shape that has to be wrestled into a spreadsheet afterwards: inconsistent names, units buried in free text, two observers using different labels for the same thing. Counter App by GiveMeMood can export to CSV, Excel and HTML on an Android phone, but the export is only as tidy as the structure you build before the first count.
This article works backwards from the file you want and shows how to set up counters so the CSV needs little or no cleaning.
What table should a field data export produce?
Before you create anything in the app, sketch the table your analysis needs. For most count-based field work it looks like this: one row per sampling unit and variable, with columns for site, unit, variable name, count and perhaps location or date. A tidy layout ("long format") is easiest to reshape later in R, Python or a spreadsheet pivot table.
Then ask three questions:
- What is my sampling unit? A transect, a quadrat, a point count station, a trap, a time interval?
- What are my variables? Species, behaviour codes, vehicle classes, material types?
- What context do I need to carry along? Location, observer, weather, visit number?
The answers decide how you use categories, counters and tags.
Mapping structure to columns
The app has three structural layers:
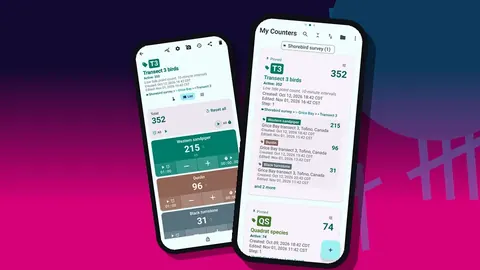
- Categories nest up to three levels and act like grouping columns: project, site, visit.
- Counters are your sampling units. Each one has a name, color, code, description, notes and link.
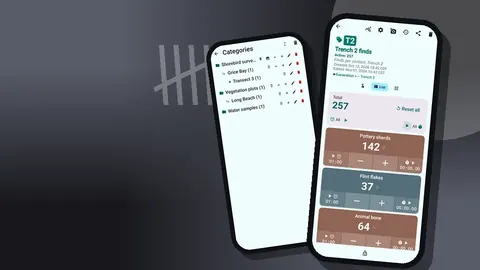
- Tags inside a counter are your variables. Each tag has its own value, step, target, color, location, barcode, timer, stopwatch and notes.
A sensible default is one counter per sampling unit and one tag per variable, with the same set of tags on every counter. When the tag list is identical everywhere, the Summary export lines up into a clean grid.
The alternative, one counter per variable with units as tags, is occasionally useful, for instance when the variable list is short and the units are many. Pick one layout for the whole project and stick to it.
Naming conventions that survive analysis
Names become identifiers, and identifiers break analysis when they are inconsistent. Some rules that save hours:
- Use a fixed pattern. "S01-T2-Q05" rather than a mix of "Site 1 T2 q5" and "S1/T2/Q05".
- Zero-pad numbers so alphabetical sort matches numeric order. The counter list offers six sort orders, but none of them can rescue "Q10" sorting before "Q2".
- Keep variable names short and stable. "dunlin" not "Dunlin (adult, foraging)". Put qualifiers in notes or in separate tags.
- Avoid commas and line breaks in names. CSV handles quoted text, but some tools and quick scripts do not.
- Use the counter code field for the compact ID your database expects, and the name field for something a human recognises.
Search in the counter list makes finding a unit quick in the field, and that search only helps if names follow a pattern you can type.
Tags become variables
Each tag's label becomes a value in the exported data, so treat labels as variable names. Give every tag on every counter the same spelling and capitalisation. Colors do not export as data, but consistent colors reduce mistakes during counting, which matters more.
Steps deserve a note in your metadata. A tag with a step of 5 records 5 per tap, and the exported value is the total, not the number of taps. If some tags use a step other than 1, write that down in the counter description and in your README.
Tag locations can be GPS, a point picked on a map or typed text. For analysis, typed codes that match your site register are usually more useful than raw coordinates, unless you are mapping.
Which export sections does a field analysis need?
The export options dialog offers four sections that can be ticked independently:
- Summary: totals per tag for each counter. This is the core table for most analyses.
- Events: every individual count with its timestamp, step and resulting value. Needed for anything time-based: rates, intervals, activity patterns.
- Notes: free-text notes attached to counters, tags and events.
- Locations: the stored locations for tags.
Export only what you need. A Summary-only CSV is small and easy to check. Adding Events can make a file much longer, which is fine for a script but awkward to eyeball.
CSV, Excel or HTML?
CSV is the default for analysis. It is plain text, readable by everything and easy to version-control.
Excel (XLSX) suits collaborators who live in spreadsheets, and it avoids some of the encoding and delimiter surprises that CSV files cause in certain locales.
HTML report is not for analysis. It is a readable document with photos embedded, which makes it a good attachment for a field report, a landowner or an archive.
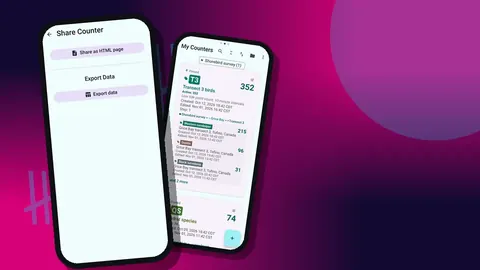
The share screen offers sharing a counter as an HTML page and exporting data. Photos never go into CSV; for those, use the HTML report or a backup ZIP.
The Events section in practice
The Events export carries the same information you see on the in-app history screen: each plus or minus with exact time, step, value before and after, and the tag. That lets you rebuild the counting session afterwards: how many detections fell in the first minute of a point count, or whether one observer counted in bursts.
Two cautions. Corrections appear as minus events, so if your analysis sums events, include them rather than filtering them out. And history in the app has no search, so if you want to audit a long session, export Events and filter in your tool of choice.
Notes as qualitative data
Notes are where context lives: weather, disturbance, uncertain identifications, method deviations. They export as text, and they are valuable precisely because they are unstructured.
A little discipline helps. Agree on a few prefixes, such as "WX:" for weather and "ID?:" for uncertain identifications, so you can filter notes with a simple text match later. Read through the All Notes screen, which lists notes with tag labels and times and can be sorted, before exporting, and fix typos at the source.
A quick sanity check before export
Open the dashboard for each counter before exporting. It shows total and target, increments against decrements, a seven-day activity bar chart and a pie chart by tag. If decrements are unusually high, someone may have been correcting heavily or a pocket tap slipped through. Check the history and fix the data in the app before it reaches your files. Locking finished counters prevents most of these problems in the first place.
How do you clean and merge exported field CSV files?
Even with good structure, expect some cleaning:
- Standardise column names if you combine exports from different app versions or setups.
- Check encodings when names contain accented letters; open the CSV as UTF-8.
- Parse dates explicitly. Tell your tool which date format to expect rather than trusting auto-detection.
- Bind files by rows, then add any context columns, such as observer or visit, that you encoded in category names.
- Reshape long to wide only at the end, for the specific analysis that needs it.
Keep the raw exports untouched and do all cleaning in a script, so you can rerun it if you find a problem.
Several observers
There is no live sync between phones, so multi-observer projects need a plan:
- Give each observer a distinct category or a distinct counter prefix, so files never collide.
- Each observer exports CSV at the end of the day and names the file with date and initials.
- Alternatively, each observer creates a backup ZIP, which can be limited to selected counters or categories and can compress photos.
When a backup ZIP is imported, a preview shows its contents and asks how to treat duplicates: replace, copy or skip. Note that "copy" creates duplicate counters, which is right for keeping both versions but wrong for routine merging.
Date formats and locale
The app offers five date formats in settings. Choose one that your analysis tools parse cleanly, and use the same choice on every phone in a team. If collaborators work in different languages, the app's 37 interface languages will not change your tag labels, but each phone keeps its own date format setting, so agree on one before the season starts.
Documenting your data
A dataset without documentation is a puzzle for your future self. Alongside the exports, keep a short README that records:
- what each category, counter and tag represents;
- any tag with a step other than 1;
- note prefixes and their meanings;
- which phone and observer produced each file;
- the date format used.
Backups as the master record
Exports are snapshots. The backup ZIP is the closest thing to a complete record, since it includes photos and can be imported again later. Field data is stored on the phone, with no Counter App cloud, so make a backup at the end of every field day and copy it somewhere safe. Deleted counters can be restored from the trash, but that does not protect against a lost phone.
A hypothetical workflow
Picture a two-person team surveying twelve ponds for amphibian egg masses. Categories are Pond survey → Visit → Observer, counters are named "P01" to "P12", and every counter carries the same four tags. Each evening both observers export Summary and Notes as CSV, make a backup ZIP and copy everything to a shared laptop folder named by date. A short script binds the CSVs, adds visit and observer columns from the file names and writes one tidy table. The setup and numbers are an example, not a description of a real project.
Get the app at counterapp.online.
Frequently asked questions
Which file formats can field counts be exported to?
Counter App exports CSV and Excel (XLSX) files for analysis, plus an HTML report that embeds the tag photos for reading and archiving.
Can a field researcher pick which sections go into a CSV export?
Yes. Summary, Events, Notes and Locations are separate checkboxes, so a researcher can export only the totals or add the full event log.
Are field photos included in a CSV export?
No. Photos are embedded in the HTML report and included in backup ZIP files, not in CSV.
How are CSV exports from several observers' phones merged?
There is no live sync. Merge exported CSV files in your analysis tool, or import backup ZIPs with a preview that offers replace, copy or skip for duplicates.
Does exporting field data require an account or cloud storage?
No. Counter App needs no account and has no Counter App cloud; the data is stored on the phone, and you decide when and where export files go.
Does the exported value for a step-5 tag show taps or the total?
The export shows the total. A tag with a step of 5 adds 5 per tap, so record any non-default step in the counter description and the dataset README.
Do minus taps appear in the Events export?
Yes. Corrections are logged as minus events, so an analysis that sums events should include them rather than filter them out.