Counter App

Food Waste Tracking for Restaurants and Cafés on Android
Key takeaways
Food waste tracking on an Android phone works only if logging is faster than scraping the plate. In Counter App — Tally & Clicker, a shared phone by the bin holds one waste counter with a tag per reason, the volume keys log discards without unlocking, and weekly exports to a spreadsheet put a rough cost on each cause.
- A kitchen food waste log should start from one question, such as over-ordering or over-prepping, because each calls for logging a different reason.
- Five common food waste reasons to log are prep trim, spoilage, overproduction, plate returns and drops or remakes.
- Counter App — Tally & Clicker counts and timestamps food waste but does not price it; unit costs are added in a spreadsheet after export.
- A shared phone kept by the kitchen bin, with the waste counter open, removes the main excuse for not logging.
Waste is the line on a kitchen's numbers that nobody can quite explain. Everyone knows it is there and everyone has a theory: the new supplier, the weekend cooks, the portion of fries. Hardly anyone has data, for an obvious reason. Waste happens in a second in the middle of service, and nobody stops to write it down.
A waste log works only if logging takes less time than scraping the plate into the bin. Everything below follows from that one constraint.
What question should a food waste log answer?
Before you log anything, decide what you are trying to learn. Different questions call for different logs:
- "Are we over-ordering?" Log spoilage: product that went off, passed its date or arrived unusable.
- "Are we over-prepping?" Log overproduction: prepped food left at close and discarded.
- "Are portions right?" Log plate returns: food coming back from the dining room.
- "Is prep technique costing us?" Log trim: peel, bones, offcuts beyond what the recipe expects.
- "Are mistakes costing us?" Log drops and remakes: burnt, dropped, wrong order, sent back.
You can track all of them, and the setup below does. But if your team has never logged waste, start by paying attention to one or two. A log that demands everything on day one usually records nothing by day five.
One counter, five reasons
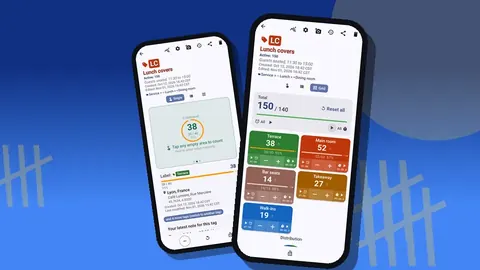
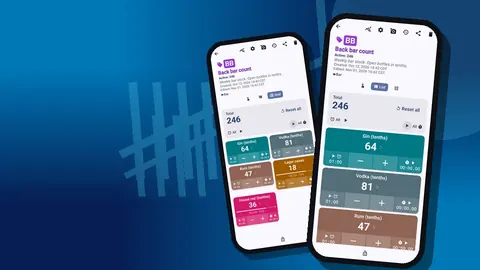
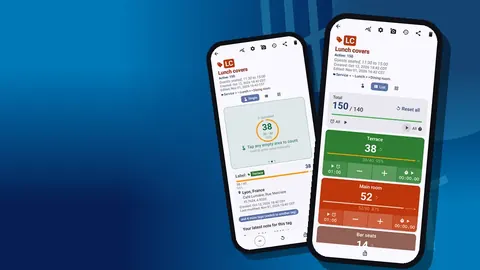
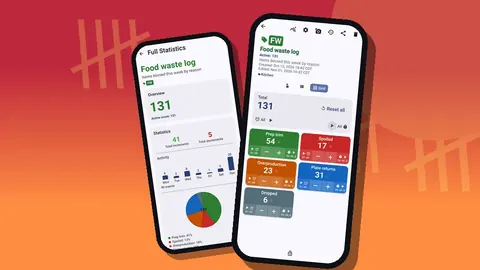
The simplest structure is a single counter called "Food waste log" with one tag per reason: Prep trim, Spoiled, Overproduction, Plate returns, Dropped. Give each a distinct color. On the counting screen, Grid view shows five large colored tiles, each with its value and minus and plus buttons, which is about as fast to hit as a phone gets. List view shows the same tags as rows with their values and progress if you set targets.
This structure answers "what kind of waste do we have most of", which is the right first question. Item detail goes into notes.
When to go deeper
After a few weeks, one reason usually dominates. That is when to add detail. Create a separate counter for that reason with a tag per item or item group: "Spoiled: salad leaves", "Spoiled: dairy", "Spoiled: soft fruit". Or, if accountability by station matters, create a counter per station with the same five reason tags. Put the waste counters together in a "Waste" category, pinned, so they open first.
Avoid more than eight or ten tags per counter. A cook with a plate in one hand will not scroll.
Units and steps that are quick to log
Waste rarely arrives in tidy units, so agree on something countable:
- Portions for proteins and plated food.
- Half-pans or quarts for prep.
- Each for bread, pastries and fruit.
- A fixed weight step if you prefer to weigh.
For weight, put a kitchen scale by the bin and log in fixed increments. With a step of 1 per 100 g, a 600 g discard is six taps; with the step set to 5 and each tap meaning 500 g, a full tray is one tap. Steps run from 1 to 100 per tag. Write the rule in the tag name, such as "Overproduction (per 100 g)", so nobody guesses.
Targets are optional here. Some kitchens set a weekly ceiling as a target on each reason; the alert then tells you a line has been crossed. Others leave targets off and simply compare weeks.
Logging in under a second
Speed decides whether the log exists at all.
- A phone by the bin. If every cook has to find their own phone, nothing gets logged. One shared kitchen phone on a shelf next to the waste station, with the waste counter open, removes the excuse.
- Volume keys. Turn on volume-button counting in settings and a cook can log a discard with a side key without unlocking. It works in the background and on the lock screen through a foreground service, keys can be remapped, and each key can have its own sound and vibration. It is off by default, and some phones may still show the system volume bar.
- Lock-screen notification. Minus, plus and stop buttons sit on the notification itself.
- Undo is easy. A wrong tap is fixed with minus; history keeps both events, so nothing is hidden.
Photos for the waste that matters
Most waste is routine. Some of it is a story: a case of greens that arrived bruised, a walk-in that ran warm overnight, a sauce that split twice on a new cook's first shift. Those deserve context.
Each tag holds up to 6 photos. The photo editor lets you rotate, draw with a brush in six colors and add text in four fonts, so you can circle the slimy leaves or write the probe reading on the image. Notes on events carry the words: "Delivery arrived at 9°C", "Sauce split, new cook, retrained".
The gallery for supplier conversations
The All Photos screen pulls every photo from every tag into one grid with its tag label and date. When you call the supplier about a third bad case of soft fruit, you scroll one screen instead of opening tags one by one. The All Notes screen does the same for written notes and can be sorted.
What does a food waste log tell you?
History records every tap with the exact time, the step, the value before and after, and the tag label, with icons for notes and photos. Read it for patterns in time, not just quantity:
- Overproduction clustered right after close points at par levels.
- Plate returns clustered on one service may point at a cook or a dish.
- Spoilage clustered on delivery days points at receiving checks.
- Drops clustered at peak suggest a layout problem on the line.
History has no search, so keep tag names plain and put detail in notes.
The weekly review
Once a week, spend ten minutes with the head chef:
- Open the dashboard. The pie chart shows which reason accounts for most waste; the seven-day bar chart shows which days spike; increments versus decrements shows how often taps were corrected.
- Read the week's notes on the All Notes screen.
- Pick one cause to fix this week. Only one.
- Decide whether to reset the counter for a fresh week or keep it running and compare exports.
Some fixes are obvious once the numbers are in front of you: a par set too high, a garnish piled too generously, a supplier whose produce keeps arriving tired. Others need a conversation with the team. Either way, the discussion starts from a log rather than a hunch.
How do you put a cost on food waste?
The app counts; it does not attach costs. From the share screen, export the waste counters to CSV or Excel, choosing Summary for totals and Events when you want timing. In your spreadsheet, add a unit cost column per tag and multiply. A rough cost by reason is enough to rank causes; you do not need accounting precision to know which one to tackle first. An HTML report, with photos embedded, suits a monthly note to the owner.
A hypothetical first month
Illustrative example only, not a real case and not measured data. A small café decides to watch two reasons: overproduction of pastries at close and milk poured away. In week one, nobody remembers to log. In week two, a phone goes on the shelf by the bin with the waste counter open in Grid view, and taps start appearing. By week four the dashboard bar chart shows most pastry waste landing on the same two weekdays, so the café bakes a little less on those days. The milk taps cluster during the morning rush, which points at steaming pitchers being overfilled, and that becomes a five-minute training chat. Nothing clever was needed, only a log easy enough to keep.
Rolling it out to the team
Introduce the log at a pre-shift meeting, not by a note on the wall. Show the phone, the five tiles and the volume keys, and log one fake discard together so everyone sees how quick it is. Say what the numbers are for and who reads them. Then agree three rules: the phone lives by the bin, every discard gets a tap, and anything unusual gets a photo.
For the first fortnight, the head chef checks the log at the end of each service and thanks people for logging, especially when the numbers are ugly. Logging should feel normal, not risky. After that, the weekly review takes over, and the team should hear what changed because of it.
Traps to avoid
- Logging as punishment. If cooks think the numbers will be used against them, logging stops. Say clearly that the goal is fixing systems.
- Too many tags. Group small items; detail goes in notes.
- No follow-through. A month of logging with no change teaches the team to stop.
- Moving the phone. The phone lives by the bin, always.
Waste usually starts upstream. The mise en place count helps set prep pars, and the restaurant inventory count helps set order quantities.
Pick a question, put five reason tags on a phone by the bin, photograph the incidents that matter and fix one cause a week. Get the app at counterapp.online.
Frequently asked questions
Can a kitchen log food waste by both reason and item?
Yes. Start with one waste counter holding a tag per reason, then add a counter for the dominant reason with a tag per item once a pattern appears.
Can I photograph spoiled produce for a supplier complaint?
Yes. Each tag takes up to six photos, editable with brush, text and rotation, and the All Photos screen gathers them with labels and dates.
Does Counter App put a cost on food waste?
No. Export the waste counter to CSV or Excel and multiply each tag's count by its unit cost in the spreadsheet.
Is there a weekly food waste summary on the phone?
The dashboard shows a pie chart by reason, a seven-day activity bar chart and increments versus decrements. Exports give a written version.
Can cooks log a discard without unlocking the kitchen phone?
They can, provided volume-button counting has been switched on in the app settings. The lock-screen notification also carries minus, plus and stop buttons.
How should food waste be measured when it is not in portions?
Agree a countable unit, such as half-pans, each, or a fixed weight per tap like 100 g, and write it in the tag name.